Cinderhaven · Monday Morning Dashboard
Velocity · Retailer P&L · Triage Tracker
What this replaces: The Monday morning Excel workbook built from four separate retailer CSV exports, reconciled by hand, with store count definitions that don’t always agree with the broker’s numbers. This table pulls from the same scan data, applies one consistent store count definition, and updates when the underlying data refreshes.
How to read it: Each row is one SKU at one retailer. The 4-week and 12-week velocity columns show units per store per week. The % change column compares the two. A negative number means the SKU is decelerating. The data quality flag marks SKUs with active defects in the product master. Filter by retailer, product line, or quality tier using the controls above the table.
What to look for: SKUs where velocity is dropping and the data quality flag is red. A velocity decline at a clean SKU is a commercial problem. A velocity decline at a flagged SKU may be a data problem disguised as a commercial one.
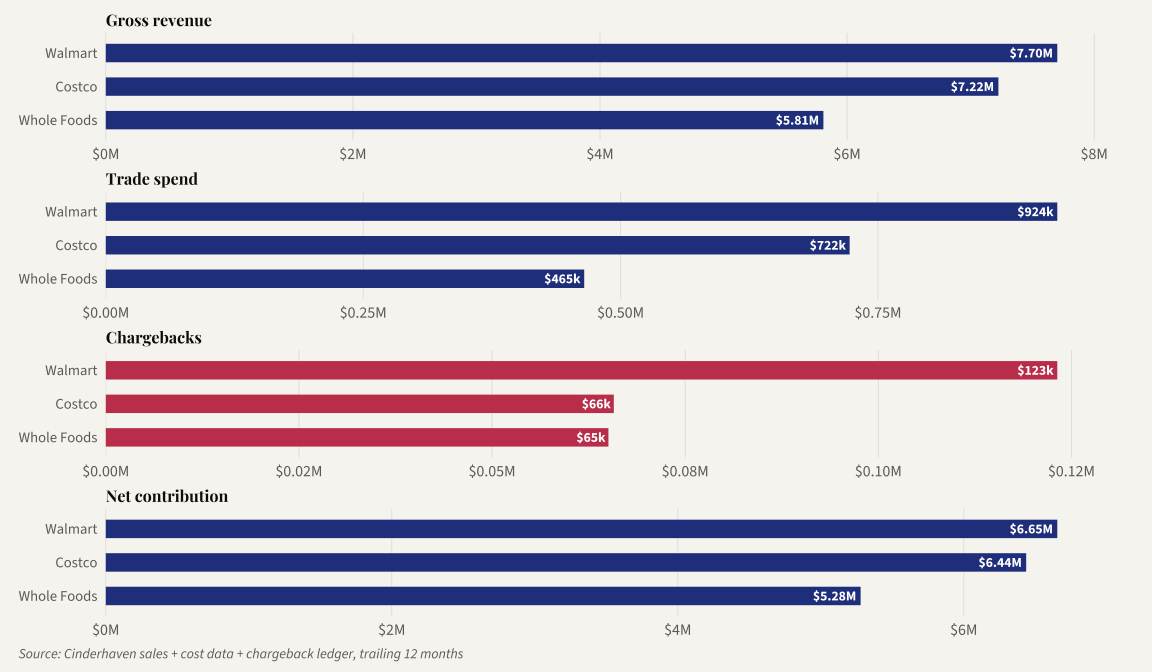
What this shows: Gross revenue, trade spend, chargebacks, and net contribution by retailer — four separate bars per retailer so every number is readable.
How to read it: Gross revenue and net contribution are the bookends. Trade spend and chargebacks are the two things subtracted in between.
What to look for: The gap between gross revenue rank and net margin rank. Walmart is #1 in gross dollars and #6 in net margin percentage. Whole Foods is #4 in gross dollars and #3 in net margin. Chargebacks are the only margin component in this chart that is entirely within Cinderhaven’s operational control.
What this shows: All 50 SKUs ranked by fix priority. The composite score weights revenue (40%), data quality (30%), and chargeback exposure (30%). Effort is shown separately.
How to read it: Sort by composite to see what matters most to the business. Sort by estimated fix hours to see what’s fastest. Sort by savings per hour to see the highest-return fixes. The “still broken” column shows the specific defect generating active chargebacks. If that column is blank, the SKU has no active chargeback-linked defects.
What to do with it: Use the composite column to set the quarterly cleanup agenda. Use the effort column to fill a Tuesday afternoon. Start with the 6 highest-return fixes at the top of the savings-per-hour column. Together they take about 4 hours and recover roughly $12k–$18k per fix-hour.