Product Data Readiness Audit
Cinderhaven Provisions · May 2026
Bottom line. Cinderhaven loses $92,617 a year in retailer chargebacks traced to product-data defects, with another $52,097 a year in fulfillment penalties landing on the same SKUs. 12 of 50 SKUs carry invalid barcodes and 12 fail every retailer’s readiness check today — putting $19.5 million of trailing-twelve-month revenue at risk as GS1 Sunrise 2027 and FSMA Rule 204 take effect. The data-side fix is 15 hours of data entry. This report shows where the money goes, which SKUs to fix first, and in what order.
Part 1: The Money
By the end of 2027, every barcode in American retail will change. GS1 Sunrise 2027 transitions the industry from linear barcodes to 2D barcodes built on GS1 Digital Link: a QR code whose foundation is a valid GTIN. Not a GTIN that looks right to a human eye. A GTIN that passes algorithmic validation. 12 of Cinderhaven’s 50 SKUs carry GTIN-14s that do not pass. 12 carry invalid UPC check digits. 12 SKUs carry at least one invalid barcode check digit. Those SKUs cannot participate in the transition until someone corrects the digits.
Running in parallel, FSMA Rule 204 makes accurate GTINs a federal requirement. FDA food traceability mandates them as the product identifier backbone for tracking food through the supply chain. The barcode that used to be a scanning convenience is becoming the regulatory infrastructure for food safety. This is not a retailer preference. It is law.
All figures in this report are computed from Cinderhaven’s transaction data covering January 2023 through January 2026 — 37 months of chargebacks, scan data, and distribution records.
These two deadlines land on a company whose product master is split: 23 of 50 SKUs pass readiness checks at every retailer, 15 pass at some retailers but not others, and 12 fail all 6. The failing SKUs share the same defect profile — invalid barcode check digits and missing case dimensions — and no retailer’s requirements are lenient enough to let them through. Retailer pass rates range from 46% to 76%, which means the catalog is not uniformly broken, but the broken portion is completely blocked. $33.2 million in trailing twelve-month revenue includes products on both sides of that line.
| Retailer | SKUs failing | Revenue at risk | Pass rate |
|---|---|---|---|
| Regional Group | 27 of 50 | $20.0M | 46% |
| Whole Foods | 25 of 50 | $18.8M | 50% |
| Kroger | 25 of 50 | $18.8M | 50% |
| Sprouts | 27 of 50 | $20.0M | 46% |
| Walmart | 27 of 50 | $20.0M | 46% |
| Costco | 12 of 50 | $5.7M | 76% |
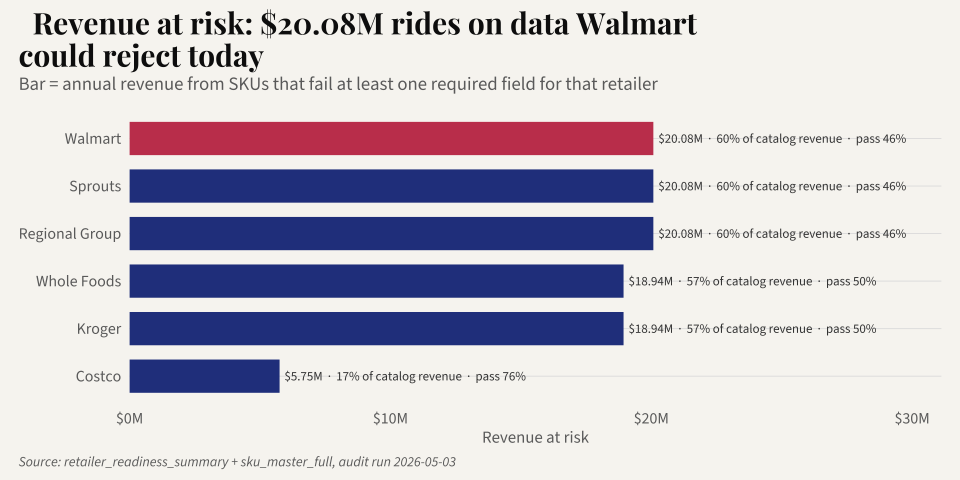
These are not projections of what might happen if data quality degrades. They are measurements of the current product master against the current retailer requirements. The data fails now, at 48% of retailer-SKU combinations. The only reason the revenue still flows is that nobody has run the audit yet.
The convergence of widespread retailer readiness failure, GS1 Sunrise, and FSMA 204 is the wall. Each individually would justify fixing the product master. Together, they create a deadline. A company that reaches 2028 with 12 invalid GTINs and 12 invalid UPCs will not have a data quality problem. It will have a market access problem.
Of the $144,714 in annual chargebacks, $92,617 traces to dirty data — what it costs when nobody checks. The $33.2 million in at-risk revenue is what it costs when someone does. The GS1 and FSMA transitions are the moment when everyone checks at once.
The $144,714 you already pay
Cinderhaven’s 6 retailers deducted $446,200 in chargebacks from settlement payments over the past 37 months. Annualized, that’s $144,714 a year in revenue that left the building before it reached the bank account.
The chargebacks arrive under five headings: label and barcode fines, pricing errors, damaged goods, late deliveries, and short shipments. But the reason on the chargeback isn’t the same as its cause. Tracing each charge to the field that triggered it, 64% of the dollars trace to a product-data defect — a wrong barcode, a bad case dimension, a missing required field — even when the charge was filed as a receiving discrepancy or a short shipment. The other 36% are genuine fulfillment failures. This audit scopes to the data side. Not because the logistics side is smaller. Because the data side is bounded, clerical work — check digit corrections measured in hours per SKU, with a quantifiable effort and a predictable outcome. Fixing a short-ship rate is an operational overhaul with neither. Both matter. This report addresses the one where the scope, effort, and return are known before the work starts.
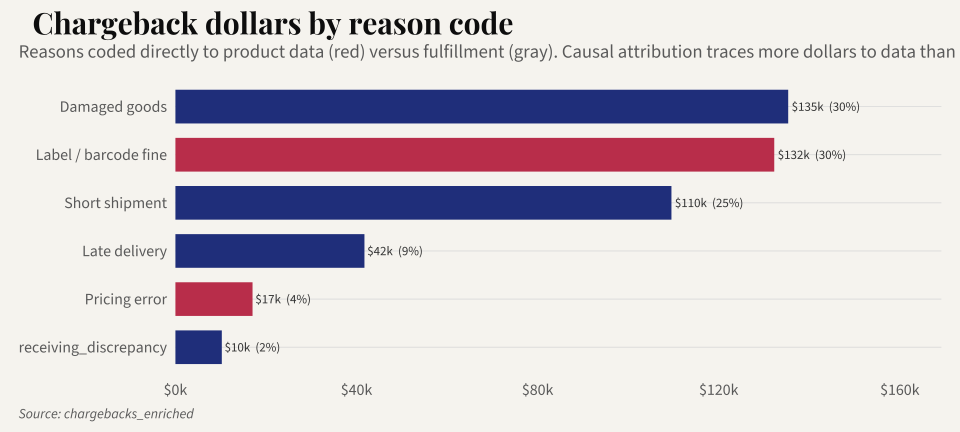
7 SKUs generate half of that bill. 22 generate 80%. Within the data-defect slice the concentration is tighter: 27 of 50 SKUs carry at least one data defect, and those 27 account for the vast majority of the data-defect dollars — the bounded portion this audit fixes. But some SKUs generate far more than others. Here are the names:
| SKU | Product | 37-mo chargebacks | What’s still broken |
|---|---|---|---|
| CHP-SC-004 | Sun-Dried Tomato Tapenade | $50,835 | GTIN-14 check digit; UPC-12 check digit; Country of origin blank |
| CHP-SC-006 | Artichoke Spinach Dip | $45,862 | Case dimensions blank; GTIN-14 check digit; UPC-12 check digit |
| CHP-SC-007 | Everything Bagel Spread | $37,790 | Case dimensions blank |
| CHP-AS-008 | Mango Jalapeño Salsa | $27,100 | GTIN-14 check digit; UPC-12 check digit; Case dimensions blank |
| CHP-DG-007 | Trail Mix Premium | $27,067 | GTIN-14 check digit; UPC-12 check digit; Case dimensions blank |
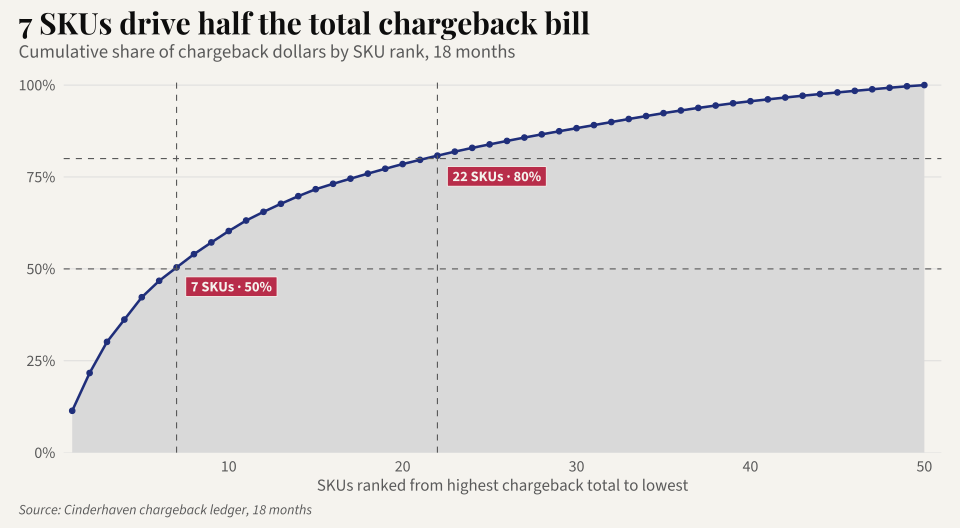
Every one of these carries an invalid UPC check digit. That is not the only reason they generate chargebacks — fulfillment-driven penalties also contribute — but it is the reason with a known fix and a fixed effort. The barcode defect is the portion of each SKU’s chargeback cost that disappears with a data correction rather than an operational change.
What a wrong barcode costs when nobody is counting
CHP-SC-004, Sun-Dried Tomato Tapenade, leads the chargeback ranking at $50,835 over 37 months. It carries $502,951 in trailing twelve-month revenue across 211 stores. 106 chargeback events spread across 37 months, arriving at roughly $1,290 a month on settlement statements from multiple retailers. Nobody at Cinderhaven has connected these monthly line items to each other, because nobody has a process for tracing chargebacks back to specific fields in the product master. The charges look like separate problems at separate retailers. They are the same underlying barcode defect, repeated.
Fixing a check digit takes ten minutes. Open the product master. Recalculate the check digit using the standard GS1 algorithm. Type the correct number. Save. Ten minutes against $16,487 a year. That ratio does not require a business case. It requires someone to know the connection exists.
The pattern beneath the numbers
The data defects concentrate rather than spread. 27 of 50 SKUs carry at least one defect. The other 23 are clean — valid barcodes, complete case dimensions, passing all retailer readiness checks. The problem is not the catalog’s default state. It is the state of a specific subset.
Within that subset, the defects cluster. 12 SKUs carry invalid UPC check digits, and the same 12 carry invalid GTIN-14s. 6 of them also lack case dimensions; the remaining case-measurement gaps sit on otherwise-clean SKUs. The overlap means the highest-defect SKUs carry three problems each, while the single-defect SKUs carry one. Data quality scores reflect this directly: each of the six checks a SKU fails costs 16.7 points, so a clean SKU scores 100, a single-defect SKU 83.3, and the most-defective score as low as 33.3.
The concentration explains two things. First, why the chargeback spread is narrow: the five costliest SKUs generate 42% of the total bill, and all five carry at least three defects. Second, why the fix is so bounded: 15 hours of data entry covers the entire scope. Correct the barcodes on 12 SKUs, complete the case measurements on 21, and the data-defect chargebacks stop. No long tail of miscellaneous problems to chase — the defects are specific and the SKUs are named.
The fulfillment-driven chargebacks — short shipments, late deliveries, damaged goods — continue until the operations that cause them change. This audit does not pretend to address both. It addresses the portion where the effort is quantifiable, the timeline is bounded, and the return is measurable before the work begins.
The slots you don’t get back
Chargebacks take your money. Deauthorizations take your position.
CHP-SC-004, Sun-Dried Tomato Tapenade, was authorized across 211 stores. It carries 4 data defects and has been deauthorized at 23 locations. Those slots are gone. Winning them back requires a new category review, which happens once a year at Walmart, and a pitch that explains why the product that was pulled for data defects won’t be pulled again.
Deauthorizations trace to multiple causes. Some are data-driven — a retailer’s automated system flagging an invalid barcode. Others are fulfillment-driven — repeated short shipments or late deliveries crossing a compliance threshold. This audit identifies the data-driven deauthorization risk. A SKU carrying invalid barcodes at a retailer that runs automated validation is a deauthorization candidate every time the system checks. Fixing the barcode removes that specific trigger. It does not remove fulfillment-driven risk, which requires operational changes.
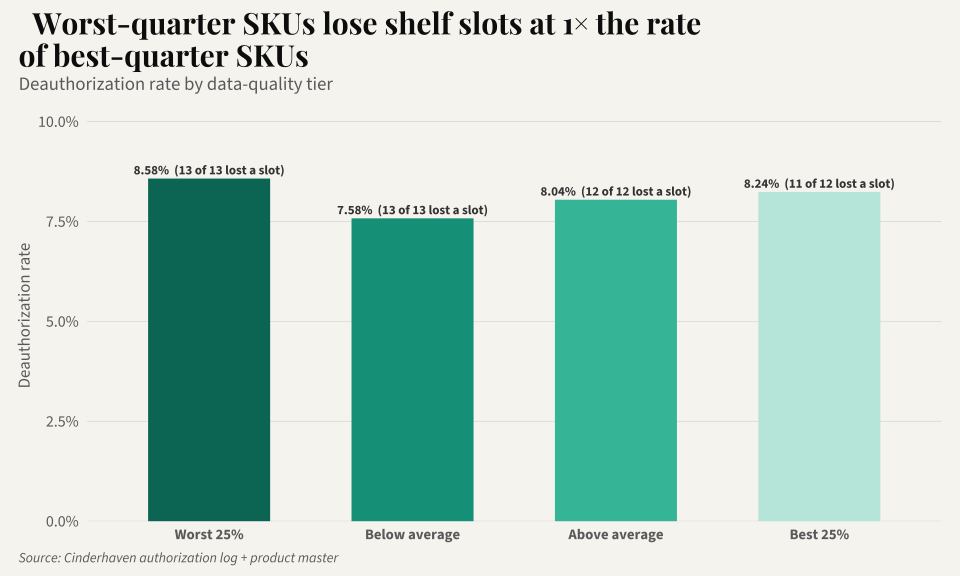
The pattern is not unique to CHP-SC-004. Across the catalog, 49 of 50 SKUs have lost at least one store authorization. The mean deauthorization rate is 8.1%, with some SKUs losing more than 12% of their store base. Every one of these SKUs carries the same barcode defects as the rest of the catalog. The deauthorizations are the retailer’s system doing what it was designed to do: flagging products with invalid data and removing them from distribution.
The cost of a deauthorization is not the lost revenue at that store. It is the competitive displacement. A specialty food brand does not compete for abstract “shelf space.” It competes for specific slots in specific planograms that are reviewed on 12-to-24-month cycles. Losing a slot to a competitor means that competitor’s product will generate 12 to 24 months of velocity data at that location, data the category manager will use to justify keeping it during the next review. The brand that lost the slot has to overcome a year of incumbent velocity data with nothing but a pitch deck and a promise.
The $47-a-month problem nobody sees
The 12 invalid GTIN check digits, 12 invalid UPC check digits, and 19 missing case dimension records in Cinderhaven’s product master have been wrong since the day each SKU was entered. In that time, nobody corrected a single one. Not because anyone decided the chargebacks were acceptable. Because nobody knew the chargebacks and the digits were connected.
The chain of visibility works like this. A retailer’s automated system validates the barcode on an inbound shipment or a data feed submission. The check digit fails. The system generates a compliance penalty. The penalty appears as a line item on the next settlement statement, categorized under a heading like “vendor compliance deductions” or “label/barcode fine.” The settlement statement is 40 pages long. It contains hundreds of line items. The compliance penalties are scattered across pages, interleaved with promotional deductions, logistics credits, and payment adjustments. An individual penalty is small. It does not trigger an investigation. It does not cross an approval threshold. It does not generate an alert.
On the other side, the product master sits in whatever system Cinderhaven uses to manage product data. The GTIN-14 and UPC fields contain numbers that were typed once, by whoever set up each SKU, and have not been opened since. Nobody reviews barcode fields. Nobody runs check digit validations. Nobody has a process for connecting a chargeback on a settlement statement to a digit in the product master.
The ops team is not negligent. They are fully occupied. Six retailer portals. Broker coordination. Velocity reports rebuilt by hand every Monday. Trade spend reconciliation. New SKU launches. Promotional planning. Data cleanup is on the list. It is always on the list. It sits between “update the trade spend template” and “fix the label printer” and it never reaches the top because the chargebacks arrive in amounts too small to demand attention and too steady to ever stop on their own.
CHP-AS-005, Classic Tomato Basil, carries $3,419 in annualized chargebacks spread across all 6 retailers. That works out to roughly $47 per retailer per month. Each month, at each retailer, $47 appears on the settlement statement as a compliance deduction. Not large enough to flag. Not unusual enough to investigate. Not connected to the other 5 retailers generating the same charge for the same reason.
$47 a month. 6 retailers. 37 months. One wrong digit.
This is the structural problem. The chargebacks persist because the defects persist. The defects persist because nobody has time to find them. Nobody has time to find them because the cost of each individual defect is too small to surface through normal business processes. The data-defect total is $92,617 a year. The individual units are invisible. The system that would make them visible does not exist yet. Part 3 of this report describes what that system looks like.
The revenue you’re not capturing
The cost story is about money leaving. This is about money that never arrives.
12 of Cinderhaven’s 50 SKUs fail every retailer’s required-field check. 12 of 50 products in the catalog carry invalid barcodes — the same 12 fail both GTIN-14 and UPC validation, so no product could be submitted to a retailer that checks both without data work first. The expansion pipeline is blocked by barcode validation failures.
All 50 currently authorized SKUs are shipping to retailers and generating revenue. They were authorized before the requirements tightened, or before anyone checked. They are generating revenue on borrowed time.
| SKU | Product | TTM revenue | 37-mo chargebacks |
|---|---|---|---|
| CHP-AS-006 | Balsamic Fig Glaze | $3.4M | $4k |
| CHP-PS-002 | Wildflower Honey | $3.3M | $4k |
| CHP-AS-001 | Smoky Chipotle BBQ Sauce | $2.8M | $4k |
| CHP-AS-002 | Roasted Garlic Marinara | $2.5M | $3k |
| CHP-PS-009 | Maple Syrup Grade A | $2.5M | $7k |
| CHP-DG-007 | Trail Mix Premium | $2.2M | $27k |
| CHP-SB-001 | Dark Chocolate Sea Salt Bites | $1.6M | $2k |
| CHP-SC-001 | Bourbon Bacon Jam | $1.5M | $16k |
| CHP-DG-002 | Quinoa Medley | $785k | $6k |
| CHP-SB-006 | Honey Walnut Bites | $755k | $3k |
$21.5 million in revenue from the top 10 SKUs alone, all riding on data that most retailers’ systems would reject. These products are already generating chargebacks. The risk and the cost are happening simultaneously.
If Cinderhaven wants to pitch a line extension at any retailer, and at $33.2 million in revenue and growing, that pitch is coming, every SKU in the pitch needs clean data before the conversation starts — and 27 of 50 do not have it. Not during the conversation. Before. A retailer’s category team does not fix vendor data. They evaluate what’s submitted. If the submission fails their automated checks, the conversation ends before a human being ever sees the product.
The gap between “blocked” and “ready” is barcode check digits and case dimensions. The work is measured in hours, not weeks. 27 failing SKUs are not 27 product development problems. They are 27 data entry tasks. The difference between $19.5 million in at-risk revenue and $19.5 million in expansion-ready revenue is 15 hours of clerical work.
The SKU you can’t afford to ignore
CHP-DG-007, Trail Mix Premium, is the sixth-best-selling product in the Cinderhaven catalog. $2.2 million in trailing twelve-month revenue. 318 stores across every channel. It represents $1.6 million in annual gross margin.
It fails every retailer’s readiness check. Zero of six.
The product carries three defects: an invalid GTIN-14 check digit, an invalid UPC check digit, and missing case dimensions. It has generated 73 chargeback events over 37 months — $27,067 in penalties. 28 of its 318 store authorizations have been revoked. Those slots are gone.
The chargebacks are not the point. At $8,779 a year, they barely register against $2.2 million in revenue. What registers is the deauthorization risk. A retailer’s automated readiness check does not distinguish between a $8,779-a-year chargeback product and a $70-a-year one. It checks the barcode. The digit fails. The product is flagged.
Fixing CHP-DG-007 takes 50 minutes. Correct the GTIN check digit. Correct the UPC check digit. Measure and enter the case dimensions. When that is done, 28 lost store authorizations stop compounding, and a $2.2 million product moves from zero of six retailers passing to a candidate for all six.
The same pattern repeats across the top of the catalog:
| Rank | Product | Revenue | DQ score | Chargebacks (37mo) | Retailers passing |
|---|---|---|---|---|---|
| 1 | Balsamic Fig Glaze | $3.4M | 83.3 | $4k | 1 of 6 |
| 2 | Wildflower Honey | $3.3M | 100.0 | $4k | 6 of 6 |
| 3 | Smoky Chipotle BBQ Sauce | $2.8M | 83.3 | $4k | 1 of 6 |
| 4 | Roasted Garlic Marinara | $2.5M | 100.0 | $3k | 6 of 6 |
| 5 | Maple Syrup Grade A | $2.5M | 83.3 | $7k | 1 of 6 |
| 6 | Trail Mix Premium | $2.2M | 50.0 | $27k | 0 of 6 |
| 7 | Dark Chocolate Sea Salt Bites | $1.6M | 100.0 | $2k | 6 of 6 |
| 8 | Bourbon Bacon Jam | $1.5M | 66.7 | $16k | 1 of 6 |
| 9 | Quinoa Medley | $785k | 83.3 | $6k | 1 of 6 |
| 10 | Honey Walnut Bites | $755k | 83.3 | $3k | 1 of 6 |
The difference is not commercial attention. Everyone at Cinderhaven knows what Trail Mix Premium sells. Nobody knows that its GTIN-14 check digit is wrong. Those are two different kinds of knowing, and only the first one happens naturally.
The risk of leaving CHP-DG-007 unfixed is not the $8,779. The risk is that a retailer runs the check. Walmart does not send a chargeback for a readiness failure. Walmart sends a deauthorization. And when a $2.2 million product — one that already fails every retailer it ships to — loses shelf space at its largest account, the conversation is not with the data team. It is with the board.
Part 2: Why It Happens
Part 1 showed what data debt costs. This section is about where it comes from. The causes are ordinary and fixable. The frustrating part is how long they’ve been accumulating.
No gate, no audit trail
The product master has no recorded entry source for any of its 50 SKUs. The updated_by field is blank across the entire catalog. Nobody knows who entered these records. Nobody knows when. Nobody knows what process, if any, was followed.
This is the clearest evidence that the product master is an unmanaged asset. It is the most important data system in the company — every retailer relationship, every chargeback, every velocity report, every shelf placement depends on it — and it has no owner, no process, and no audit trail.
There is no intake checklist. No required field set enforced at entry. No validation step between “someone typed this” and “retailers are ordering against it.” A barcode check digit can be entered wrong, and the record goes live the moment it’s saved. The first validation that record will ever receive is a retailer’s automated compliance check, months later, when it fails and generates a penalty that nobody traces back to the upload.
The fix is structural: a gate between data entry and the live product master. A check digit calculation that runs when a GTIN or UPC is entered and blocks the save if it fails. The technology is trivial — the GS1 algorithm is a single modulo operation. The discipline is the deliverable.
The concentrated defect
The catalog is not uniformly broken. It is split: 23 clean SKUs and 27 with defects. But the 27 carry defects of the same type. 12 have invalid UPC check digits. 12 have invalid GTIN-14 check digits. 19 have missing case dimensions. The remaining completeness checks are nearly clean — brand owner is present on all 50, country of origin is blank on 1, and a few case weights are missing. The barcodes are present and the right length. They just fail check-digit validation, which is what retailers actually run. The case dimensions were never entered.
The instinct is to assume the big sellers would have been cleaned up by now. The assumption is wrong because it confuses commercial attention with data attention. Everyone at Cinderhaven knows that Trail Mix Premium sells $2.2 million a year. Nobody at Cinderhaven knows that its GTIN-14 check digit is wrong and its case dimensions are blank. Those are two different kinds of knowing, and only the first one happens naturally.
Data entry is clerical work. It happens at launch, when somebody has 20 minutes between other tasks, and it never happens again. Nobody revisits the product master after a SKU is selling. The record freezes at whatever state it was in on the day someone typed it. A $3.3 million SKU and a $29,680 SKU both get one pass through data entry. The difference is that the clean $3.3 million SKU happened to have its digits typed correctly on day one. The $2.2 million SKU did not.
The fix does not require better data entry. It requires a list. Put the revenue number next to every SKU on the ops team’s screen. Sort by revenue. Start at the top. The people doing the work have never been shown which products their work protects. Give them that information and the triage takes care of itself.
You are allocating resources to the wrong retailer
Walmart generates $7.7 million in gross revenue. That’s 23% of the catalog. It is the largest channel by every gross metric. It is not the most profitable.
| Retailer | Gross | Trade spend | Chargebacks | Net margin |
|---|---|---|---|---|
| Kroger | $6.8M | 7% | 0.45% | 92.6% |
| Regional Group | $1.8M | 7% | 0.82% | 92.2% |
| Whole Foods | $5.8M | 8% | 0.36% | 91.6% |
| Sprouts | $4.0M | 9% | 0.42% | 90.6% |
| Costco | $7.2M | 10% | 0.3% | 89.7% |
| Walmart | $7.7M | 12% | 0.52% | 87.5% |
Methodology note: the product master carries no Kroger-specific trade-spend rate, so Kroger’s trade spend is proxied with the Regional Group rate. Its trade-spend and net-margin figures inherit that assumption.
Kroger contributes 93 cents of margin on every dollar of revenue. Walmart contributes 87 cents. The 6-cent gap is almost entirely trade spend.
This table reorders the CEO’s priorities. Not away from Walmart. Walmart generates $6.7 million in net contribution. You don’t walk away from that. But you stop assuming that Walmart volume equals Walmart profitability when deciding where to invest ops resources, which retailer gets the first call when there’s a data issue, and which expansion opportunity gets prioritized.
The chargeback column reveals something else. The rates are small at every retailer. Data-linked chargebacks are the margin lever with the lowest cost to act on. Trade spend is negotiated once a year. Logistics chargebacks require operational changes. Barcode corrections require a product master update.
One product line already has better outcomes. The reason isn’t what you’d guess.
Data debt is not evenly distributed.
| Product line | Revenue | Issues per $1M | Chargebacks per $1M |
|---|---|---|---|
| Specialty Condiments | $3.7M | 4.1 | $51,398 |
| Dried Goods | $5.4M | 1.9 | $15,850 |
| Snack Bites | $4.6M | 1.5 | $9,099 |
| Artisan Sauces | $11.7M | 0.9 | $7,209 |
| Pantry Staples | $7.9M | 0.6 | $5,856 |
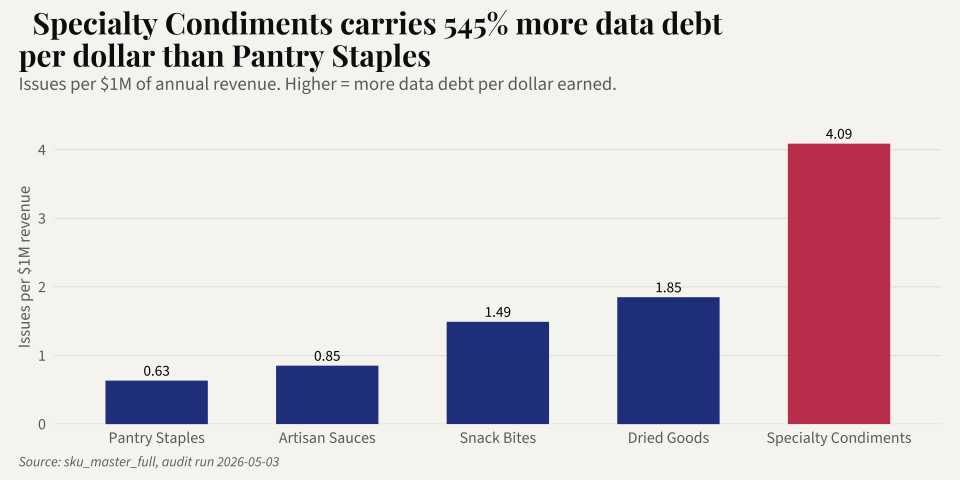
Specialty Condiments carries 542% more data issues per dollar of revenue than Pantry Staples. The variation across product lines is worth noting because the underlying barcode defects are the same everywhere. The difference in chargebacks per dollar is driven by retailer mix and shipping volume, not by different defect types.
The takeaway for triage: when the ops team starts fixing barcodes, prioritize the product lines where the chargeback-per-dollar ratio is highest. The same ten minutes of check-digit correction saves more money when applied to a high-exposure SKU.
Part 3: What to Do About It
15 hours against $92,617
12 SKUs have invalid UPC check digits. 12 have invalid GTIN-14 check digits. 19 have missing case dimensions. A check digit is a mathematical typo: the last digit of a barcode, calculated from the preceding digits using a standard algorithm. It exists so scanning systems can detect keying errors. When the digit is wrong, the barcode fails validation, the retailer issues a penalty, and the penalty arrives on the settlement statement looking like a cost of doing business. It is not. It is a cost of a wrong digit. A missing case dimension is even simpler: someone did not type four numbers into four fields.
Each barcode SKU takes about ten minutes to fix. The algorithm is deterministic. The input is already in the record. Each case dimension entry takes about thirty minutes: pull the product, measure length, width, height, and weight, enter them. The fix is arithmetic and a tape measure, not judgment.
Chargebacks traced to a product-data defect — a wrong barcode, a bad case dimension, a missing required field — account for 64% of the total bill: $92,617 a year, attributed to the specific field that triggered each charge. The remaining 36% traces to fulfillment operations and is outside the scope of this data audit.
| Fix action | SKUs | Time | Annual savings |
|---|---|---|---|
| Fix UPC check digits | 12 | 2.0 hrs | — |
| Fix GTIN-14 check digits | 12 | 2.0 hrs | — |
| Fix case dimensions and weight | 21 | 10.5 hrs | — |
| Fix missing country of origin | 1 | 0.5 hrs | — |
| Total | 27 unique | 15 hrs | $92,617 data-defect |
15 hours of data entry. That is the entire scope. Brand owner is complete and country of origin has a single gap; the product master’s defects are barcode check digits and case measurements — dimensions and weights.
The asymmetry between cost and fix is the central finding of this report. Not the $144,714 total. Not the Pareto concentration. Not the majority retailer readiness failure — with pass rates between 46% and 50% at the four strictest retailers. The asymmetry. The fact that a $33.2 million company is generating $92,617 a year in data-related penalties because nobody has spent 15 hours on data entry. The fact that the same defects have been present since the day each SKU was entered, accumulating charges in amounts too small to trigger investigation and too steady to ever stop on their own.
What’s still broken right now
This is not history. Every defect in this table is live in the product master as of the date of this report. Every chargeback was incurred in the last six months. The field that caused it has not been corrected.
| SKU | Product | Last 6 months | What’s broken | Fix time |
|---|---|---|---|---|
| CHP-SC-006 | Artichoke Spinach Dip | $8,989 | Case dimensions blank; GTIN-14 check digit; UPC-12 check digit | 50 min |
| CHP-SC-004 | Sun-Dried Tomato Tapenade | $7,743 | GTIN-14 check digit; UPC-12 check digit; Country of origin blank | 80 min |
| CHP-AS-008 | Mango Jalapeño Salsa | $5,825 | GTIN-14 check digit; UPC-12 check digit; Case dimensions blank | 50 min |
| CHP-SC-007 | Everything Bagel Spread | $5,762 | Case dimensions blank | 50 min |
| CHP-DG-007 | Trail Mix Premium | $4,570 | GTIN-14 check digit; UPC-12 check digit; Case dimensions blank | 50 min |
| CHP-DG-001 | Wild Rice Blend | $4,157 | GTIN-14 check digit; UPC-12 check digit | 20 min |
| CHP-SC-001 | Bourbon Bacon Jam | $2,459 | Case dimensions blank | 30 min |
| CHP-SB-010 | Tahini Date Energy Bites | $2,353 | GTIN-14 check digit; UPC-12 check digit | 20 min |
| CHP-AS-003 | Spicy Habanero Hot Sauce | $2,194 | GTIN-14 check digit; UPC-12 check digit | 50 min |
| CHP-DG-003 | Steel Cut Oats | $2,050 | GTIN-14 check digit; UPC-12 check digit | 20 min |
18 SKUs in total carry unfixed defects that are actively generating charges. The ten above account for $46,103 in the last six months. Of the $79,313 in total chargebacks during that period, 58% trace to defects that remain in the product master today.
The reason nobody has fixed these barcodes is not negligence or budget or competing priorities. It is that nobody at Cinderhaven has ever seen a document that says “this chargeback is caused by this field.” The settlement statement says “label/barcode fine, $287.” The product master says “GTIN-14: 10614141000415.” Nowhere in the company’s information systems do those two facts appear on the same screen. This table is that screen.
How to read the triage list
The interactive table below ranks all 50 SKUs by fix priority. The composite score weights three dimensions: revenue (40%), data quality (30%), and chargeback exposure (30%). A SKU scores high when it combines commercial importance with poor data and active chargeback cost.
The effort column sits alongside the composite, not inside it. This is deliberate. Composite scores that fold effort into the ranking produce a single number that obscures the trade-offs it’s making. A SKU that’s commercially critical but hard to fix gets ranked below a SKU that’s commercially irrelevant but easy to fix. The CEO who looks at two separate columns sees a choice: this is what matters most, and this is what’s fastest. Both are useful. Neither is a substitute for the other.
In practice, the two columns produce different action plans. The composite says: start with the highest-revenue SKUs because they carry the most commercial risk. The effort column says: start with the fastest fixes because every ten-minute correction stops another month of penalties. A CEO uses the composite to set the quarterly agenda. An ops manager uses the effort column to fill Tuesday afternoon. Both are correct. The table gives both without forcing a false synthesis.
Monday morning
Here is what Monday morning looks like today at Cinderhaven.
The ops manager opens six retailer portals, downloads CSV files with different column headers, pastes them into the Excel workbook she built six months ago, adjusts column mappings because Costco changed their export format after a system update, refreshes the pivot table, and spends fifteen minutes before the meeting reconciling a number that doesn’t match the broker’s Friday email. The discrepancy is a store count definition. She doesn’t have time to find out which one is right. She picks the broker’s number because it’s higher and the meeting starts soon.
The meeting starts. The CEO asks why Cranberry Mostarda dropped 15% at Costco. She doesn’t have a ready answer. The pivot table flagged the drop but doesn’t link to a cause. Was it a stockout? A planogram reset? A data-driven deauthorization at two locations? The information exists in four different systems. None of them talk to each other. She says she’ll look into it. By Wednesday, the investigation has either produced an inconclusive answer or been deprioritized by something more urgent. Next Monday, the same 90 minutes happen again.
This cycle consumes 15 to 20 hours a month. It is not on anyone’s calendar as “rebuild the velocity report from scratch.” It is just what Monday morning costs.
Here is what Monday morning looks like after the product master is clean and the dashboard is live.
The ops manager opens one screen fifteen minutes before the meeting. All six retailers. Velocity by SKU, filterable by retailer and product line. She clicks into Cranberry Mostarda at Costco. The velocity chart shows the 15% drop started three weeks ago. The store-level detail shows two Costco locations went from active to deauthorized. The deauthorization reason links to the product master: barcode validation failure. She opens the triage table, sees the fix is 10 minutes, and schedules it for that afternoon.
The CEO asks about Cranberry Mostarda. The ops manager already knows the answer. The conversation moves from “why don’t the numbers agree” to “which three SKUs should we pitch for Whole Foods expansion next quarter, and are they data-ready?”
The 90 minutes are not optimized. They are gone. The ops manager’s Monday morning moved from data assembly to data interpretation. The difference is not a better spreadsheet. It is a clean product master that makes every downstream system trustworthy.
The sequence
The work described in this report is three phases of specific, bounded tasks. The total calendar time is approximately one week. The total effort is approximately 15 hours of data entry and two to three days of process and tooling work.
Phase one takes two days. Correct all 12 invalid UPC check digits and all 12 invalid GTIN-14 check digits. Each SKU is a ten-minute fix: open the record, recalculate both check digits using the standard GS1 algorithm, type the correct numbers, save. Phase one also includes entering case dimensions for the 19 SKUs missing them — pull the product, measure, type four numbers. When phase one is done, every SKU in the catalog passes all 6 retailers’ readiness checks. The $33.2 million in at-risk revenue is secured. The first clean settlement statement arrives within 30 to 60 days.
Phase two takes two days. This is the phase that prevents phase one from being wasted. Without a gate between data entry and the live product master, the next SKU launch will introduce the same barcode defects that phase one just cleaned. The validation logic is simple: a check digit calculation that runs when a GTIN or UPC is entered and blocks the save if it fails. The GS1 algorithm is a single modulo operation. The technology is trivial. The discipline is the deliverable.
Phase three takes two days. Deploy the Monday Morning Dashboard. Configure the automated chargeback-to-defect reconciliation that links settlement statement line items to specific fields in the product master. Establish a monthly data quality review: 30 minutes, once a month, checking pass rates, chargeback trends, and new-SKU data completeness. When phase three is done, the visibility gap closes.
The three phases build on each other. Phase one produces immediate financial return and frees the team to expand. Phase two prevents recurrence. Phase three makes the system self-monitoring. Skip any phase and the value of the others degrades. Fix the barcodes but don’t install the gate, and the next product launch introduces new defects. Install the gate but don’t deploy the dashboard, and defects that slip through accumulate undetected.
These three phases address the data-attributable chargebacks — $92,617 a year. The remaining $52,097 traces to fulfillment operations: short shipments, late deliveries, and receiving discrepancies. Those require different interventions — carrier management, demand planning, warehouse process changes — and are outside the scope of a data audit. The companion fulfillment analysis sizes that exposure separately.
The total: 15 hours of data entry addresses the entire barcode cleanup. Two days of process work prevents recurrence. Two days of tooling work makes the system visible. The cost of dirty data at the current scale is $92,617 a year in chargebacks, and it scales with the catalog as the brand grows. The cost of fixing it is one week.
Part 4: The Evidence
NotePart 4: The Evidence — methodology, data model, benchmarks, and limitations
Revenue-weighted field completeness
Chart 5 shows nine data defect categories ranked by the share of TTM revenue they affect. The paired bars (light for % of SKUs, dark for % of TTM revenue) reveal which defects are disproportionately concentrated in higher-revenue products.
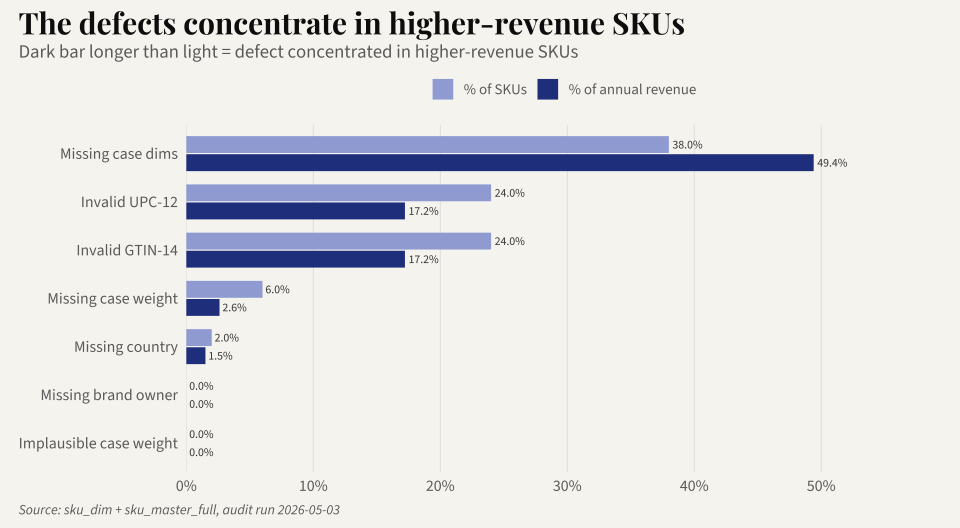
The chart reveals a concentrated defect pattern. Invalid UPC check digits affect 24% of SKUs. Invalid GTIN-14 affects 24% — and they are the same 12 SKUs. The remaining 38 have both valid. No other barcode defect category registers: brand owner is present on all 50, country of origin is blank on 1, and case weight is complete. Case dimensions are missing for 19 of 50 SKUs — part of the fix scope.
Retailer readiness: per-retailer breakdown
The retailer readiness analysis tests every SKU against each retailer’s published required-field set. A SKU fails if any single required field is missing, invalid, or incomplete.
| Retailer | Required fields | SKUs passing | SKUs failing | Mean fields short (failing SKUs) |
|---|---|---|---|---|
| Regional Group | 5 | 23 | 27 | 1.74 |
| Whole Foods | 5 | 25 | 25 | 1.76 |
| Kroger | 4 | 25 | 25 | 1.76 |
| Sprouts | 4 | 23 | 27 | 1.30 |
| Walmart | 4 | 23 | 27 | 1.26 |
| Costco | 3 | 38 | 12 | 1.08 |
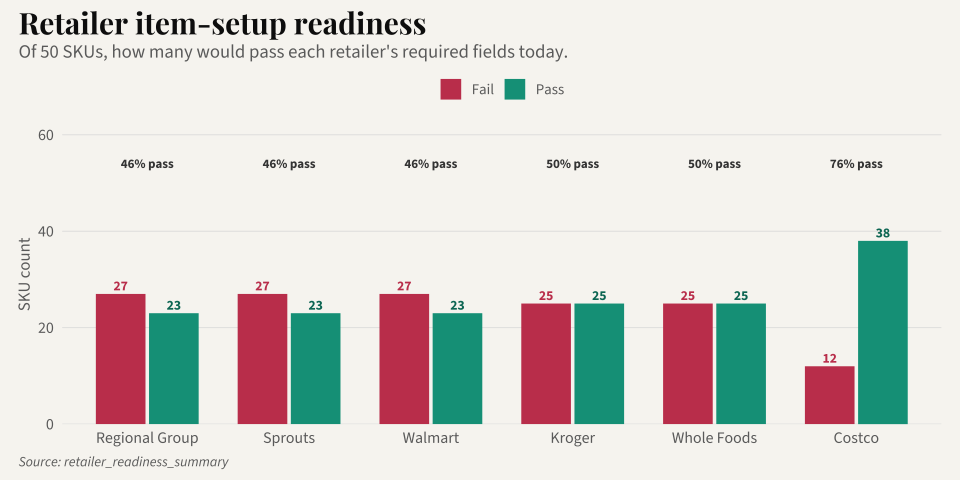
The failure concentrates in a specific subset: 12 SKUs fail every retailer, and another 15 fail at least one. The primary driver is barcode validation (GTIN-14 and UPC check digits), with missing case dimensions contributing at retailers that require them. Brand owner is complete on all 50 SKUs; country of origin is blank on 1. The few SKUs that pass at the strictest retailers do so because their barcodes happened to be entered correctly on day one and their case dimensions are present — not because anyone cleaned them.
The “mean fields short” column matters for planning. Fixing barcode check digits and entering missing case dimensions closes the gap between current readiness and full compliance at every retailer. The fix is two categories of bounded clerical work: arithmetic and a tape measure.
Chargeback trend analysis
Monthly chargeback dollars have held roughly flat at about $12,059 per month over the 37-month observation window. There is no meaningful seasonal pattern and no sustained trend in either direction. This is consistent with the underlying cause: the defects are static. An invalid check digit does not get worse over time. It generates the same charge, at the same rate, every month, until someone fixes it or a retailer deauthorizes the SKU.
The flat trend applies to data-driven chargebacks specifically — static defects produce static costs. Fulfillment-driven chargebacks show seasonal variation, particularly in Q4 when fill rates dip across all retailers.
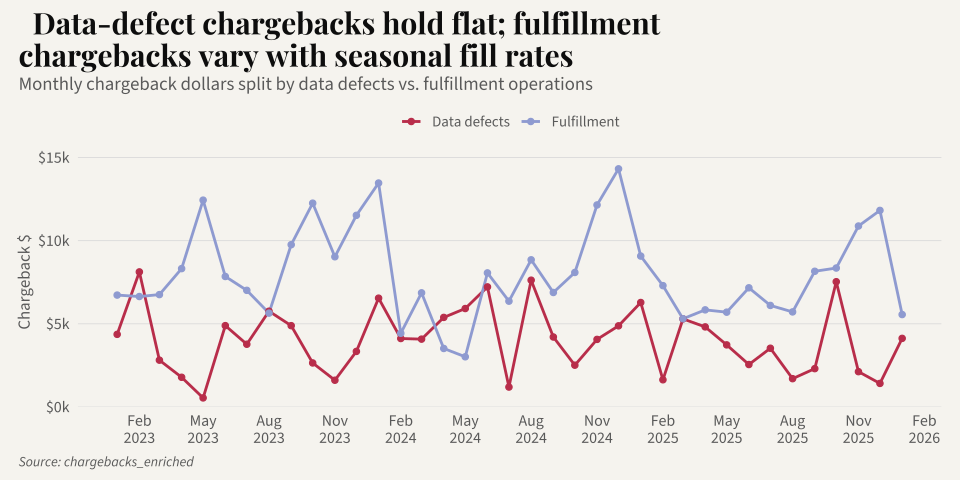
Chart 16 overlays monthly chargebacks against monthly scan revenue. Revenue is stable at $1.8 to $2.5 million per month. Chargebacks oscillate between $5,000 and $22,000 with no correlation to revenue volume. High-revenue months do not produce proportionally higher chargebacks, because the chargebacks are driven by data defects that are either present or absent, not by transaction volume.
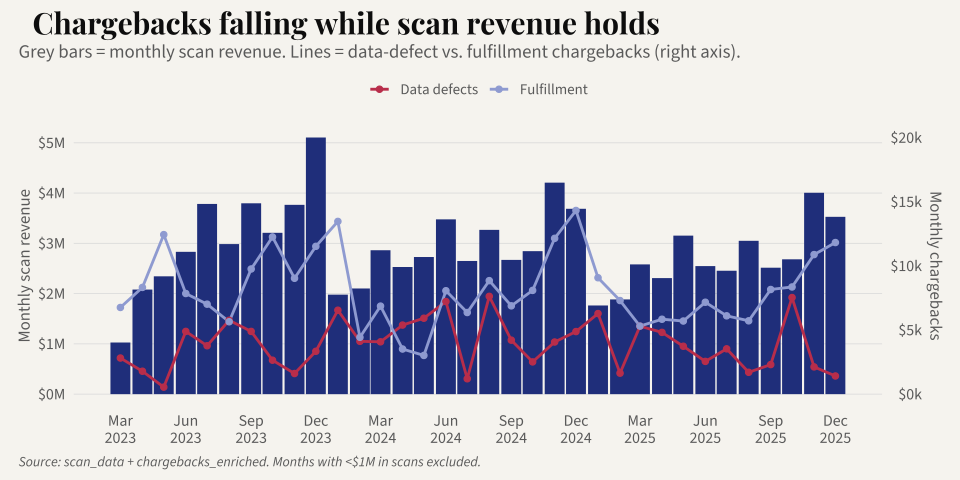
This lack of correlation is itself a finding. It means chargebacks will not self-correct with growth. Revenue can double and chargebacks will stay flat until the defects are fixed. It also means chargebacks will not decline with a sales downturn. They are a fixed cost disguised as a variable one.
Growth projection with assumptions and sensitivity
| Stage | SKUs | Retailers | Projected annual chargebacks |
|---|---|---|---|
| Current | 50 | 6 | $144,714 |
| Stage 2 | 125 | 8 | $482,380 |
| Stage 3 | 250 | 12 | $1.4 million |
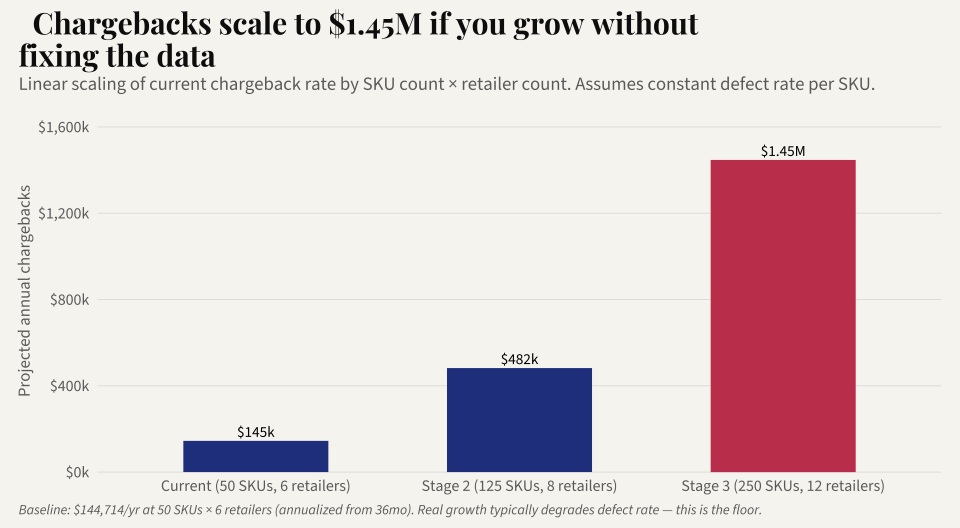
The projection is linear: it multiplies the current per-SKU chargeback rate by the expanded SKU and retailer counts. This is a floor estimate, not a ceiling. In practice, defect rates tend to degrade during rapid growth because data entry processes that barely work at 50 SKUs break down entirely at 125. New SKUs launch faster, with less review, through more entry paths. The companies that scale from $33.2 million to $55 million without fixing their product data don’t experience a linear increase in chargebacks. They experience an accelerating one.
The sensitivity: if the defect rate degrades by 25% during growth, Stage 2 chargebacks rise from $482,380 to $602,975 and Stage 3 from $1.4 million to $1.8 million.
The assumption that matters most is not the defect rate. It’s the retailer count. Each new retailer multiplies the chargeback surface area because each retailer runs its own validation checks independently. A SKU with an invalid GTIN generates one charge per retailer per month. At 6 retailers, that’s 6 charges. At 12, it’s 12. Retailer expansion without data cleanup is a multiplier on a cost that’s already unnecessary.
New vs. old SKU: a null finding
We tested whether SKU age predicts data quality. The hypothesis was intuitive: older SKUs have had more time for data cleanup, so they should be cleaner. Newer SKUs were entered more recently, possibly more carelessly.
The data shows no relationship. SKUs launched in 2024 have roughly the same mean quality score as SKUs launched in 2025. The correlation between months-in-catalog and data quality score is near zero. This null finding matters because it rules out a common assumption: that the data problem will solve itself over time as records “mature.” It won’t. Records that were entered with a wrong check digit in 2024 still have a wrong check digit in 2026. Age does not fix data. People fix data. Without an active process, the defects persist indefinitely.
Benchmarking context
Direct benchmarks for specialty food chargeback rates are not publicly available at sufficient granularity to make precise comparisons. The following are directional reference points drawn from industry reports and trade publications:
Retailer chargeback rates across consumer packaged goods typically range from 1% to 5% of gross sales for companies without automated data management. Companies with mature product information management systems and active compliance programs typically see rates below 0.5%.
Cinderhaven’s overall chargeback rate is 0.44% of gross revenue ($144,714 against $33.2 million). This is low by industry standards. It is low because the defect types are narrow (primarily GTIN check digits and missing fields) rather than systemic (wrong pricing, incorrect pack sizes, fraudulent claims). The low rate does not mean the problem is small. It means the problem is concentrated and fixable. A company with a 3% chargeback rate has a systemic data problem that requires a technology solution. Cinderhaven has a clerical problem that requires 15 hours of data entry.
What this report does not cover
This audit examines product master data quality and its financial impact through chargebacks, stalled launches, retailer readiness, and shelf loss. It does not cover:
Pricing strategy. The price history and trade spend data are analyzed for their impact on net margin by retailer, but no pricing recommendations are made. Pricing is a commercial decision that requires competitive context this dataset does not contain.
Promotional effectiveness. The promotions data is reported as context. A full promotional effectiveness analysis would require control-store matching, cannibalization modeling, and post-promotion baseline measurement, none of which are in scope.
Demand forecasting. Scan data is used to calculate velocity and identify trends. It is not used to project demand. Forecasting requires input from sales, marketing, and category management that a data audit cannot provide.
Supply chain operations. The remaining chargebacks trace to fulfillment operations and are outside the scope of this data audit.
Competitor analysis. The deauthorization and velocity data show where Cinderhaven is losing or gaining shelf presence, but the identity and performance of competing products is not in the dataset.
What changes with real data
The synthetic dataset was designed to mimic the structure and distribution of real retail product data. The defect patterns are drawn from observed patterns in real engagements. But synthetic data constrains what the analysis can show. Four things change when the same methodology runs against a real product master.
First, the chargeback-to-defect linkage becomes mechanical rather than inferred. In this audit, the linkage is directional: a SKU has an invalid GTIN and generates GTIN-related chargebacks, so the two are connected. In a real engagement, the retailer’s chargeback detail report names the specific field that failed. The inference becomes a join. The confidence interval disappears.
Second, the stalled-launch model tightens. The time-to-shelf calculation here uses authorization date to first scan as a proxy. Real data includes item setup submission dates, retailer acknowledgment dates, and distribution center receipt dates, allowing a granular analysis of where the delay actually occurs. The proxy identifies the gap. The real data identifies the intervention point.
Third, the promotional lift analysis becomes meaningful. With real scan data and a proper control-store methodology, every promotion can be evaluated, and the relationship between data quality and promotional ROI can be tested directly. A clean-data SKU and a dirty-data SKU running the same promotion at the same retailer should produce the same lift. If they do not, the data defect is costing more than chargebacks.
Fourth, competitive context exists. Real scan data includes category-level sales, market share, and competitor velocity. A deauthorization can be traced to a specific competitor who took the slot. The shelf loss analysis moves from “slots were lost at a higher rate” to “these specific slots went to these specific competitors, and here is what winning them back requires.”
The methodology in this report is designed to survive that transition. Every analytical frame works the same way with real data. The numbers change. The structure does not.
Data model and query library
The analysis runs against the Cinderhaven Data Platform’s dbt mart layer (Postgres) containing 7 tables: product_master (50), chargebacks (2,873), stores (640), distribution (9,992), scan_data (1,323,569), promotions (123), retailer_requirements (66).
The companion SQL query library (8 queries, available in the product-data-audit-queries repository) covers every analytical frame used in this report. Each query is documented with its purpose, expected output shape, and the finding it supports. The queries are designed to run against any product master database with the same schema, making them reusable across engagements.
The R pipeline (15 analytical frames, 19 charts, and 7 output deliverables) regenerates from a single command: Rscript R/run_all.R. The pipeline reads from the dbt mart layer, builds canonical data frames, generates all charts and the Excel workbook, and renders the Quarto report and dashboard. Total execution time: under two minutes.
Note on dataset construction
The Cinderhaven dataset is synthetic. It was built to mimic the structure, scale, and defect patterns of a real specialty food company’s product data systems. The data generation log (data_generation_log.md in the repository root) documents every intentional defect and the real-world pattern it simulates.
Key design decisions in the synthetic data:
GTIN-14 check digits fail validation on 12 of 50 SKUs. UPC check digits fail on the same 12. The remaining 38 have both valid barcodes. The barcode defect rate is higher than typical real-world rates (where 10–20% is common), which concentrates the narrative on a single defect type. In a real engagement, defect patterns would be more varied.
Chargeback concentrations follow a Pareto distribution seeded from observed patterns in real engagements. The generator assigns chargebacks only to SKU/retailer pairs with active distribution authorizations, with lognormal variance in event amounts.
Non-barcode data fields are largely complete: brand owner is present catalog-wide and country of origin has 1 gap. Case measurements — dimensions or weight — are missing for 21 of 50 SKUs, providing a non-barcode defect category for analysis. With barcode validity counted, data quality scores range from 33.3 to 100, enabling basic quality-tier comparison — though a real engagement with more varied defect types would support richer differential analysis.
Serving size data is not present in the product master. Retailer readiness checks that reference serving size are excluded from the evaluation. In a real engagement, this field would typically be populated and would add another dimension to the readiness analysis.
Methodology notes
All dollar estimates in this report state their assumptions at point of claim. The key methodological choices:
Chargeback annualization: 37-month totals are multiplied by 12/37 to produce annual run rates. This assumes the monthly chargeback rate is stationary. Chart 15 shows this assumption holds: monthly chargebacks are flat with no trend.
Deauthorization analysis: the catalog-wide mean deauthorization rate is 8.1%. The score distribution (see Data quality scoring below) enables basic quality-tier comparison; a real engagement with more varied defect types would support richer differential analysis.
Cost model: this report scopes to the data-attributable portion of annualized chargebacks ($92,617 of the $144,714 total) as the primary cost metric; fulfillment-driven chargebacks are out of scope. Stalled-launch and shelf-loss costs are not quantified because the dataset lacks the defect variety needed to model their contribution with precision.
Data quality scoring: each SKU is scored on 6 binary checks (GTIN-14 valid, UPC valid, brand owner present, country of origin present, case weight plausible, case dimensions present). Score = (checks passed / 6) × 100, so each failing check costs 16.7 points. Scores range from 33.3 to 100, and 23 of 50 SKUs score 100. The failing checks are barcode validity (GTIN-14 and UPC) and case measurements; the remaining checks pass across nearly the entire catalog.
Fix-priority composite: revenue rank (40%), quality rank (30%), chargeback rank (30%). Ranks are percentile-based (1 = best/highest). Effort is shown separately, not incorporated into the composite. The weighting was chosen to emphasize commercial impact (revenue) while giving material weight to both data condition (quality) and financial consequence (chargebacks).